EV Charging GuideCharging Time & SpeedWhat Is Charging Efficiency and Why You Lose 5-8%?
What Is Charging Efficiency and Why You Lose 5-8%?
Discover why not all the electricity you pay for ends up in your EV's battery, where the losses go, and how charging efficiency affects your costs and charging time.
Try it with your car
Use our free calculator to simulate your exact charging time and cost.
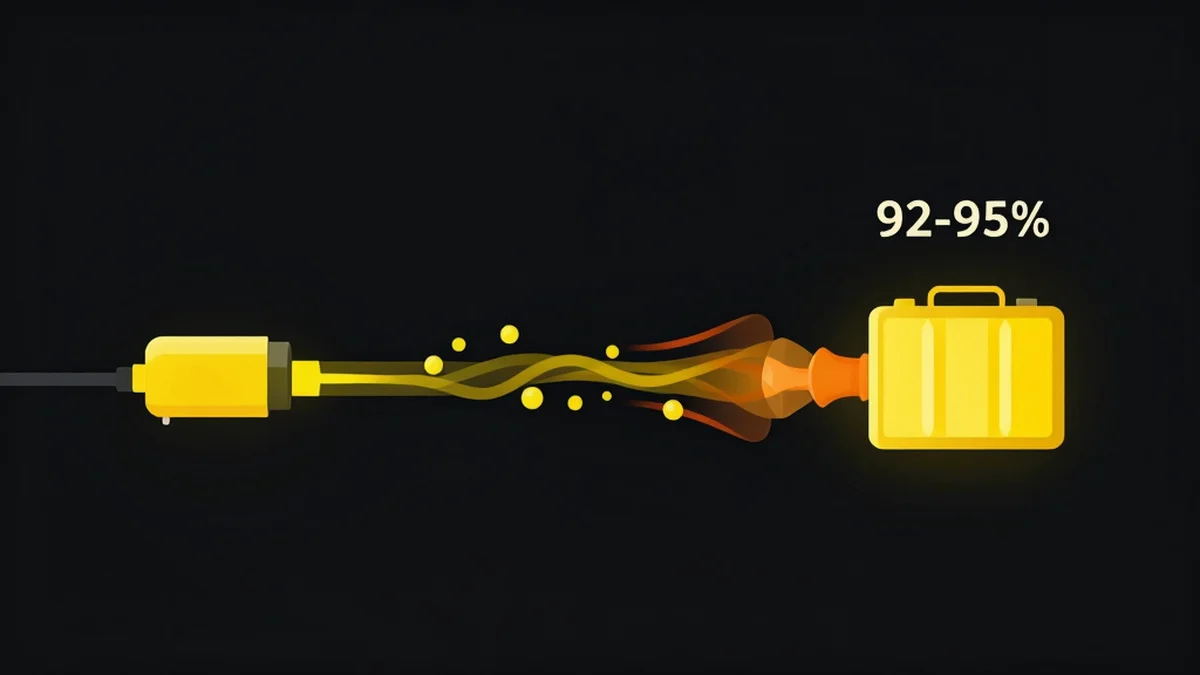
When you charge an EV, not every kilowatt-hour drawn from the grid reaches the battery. AC charging typically achieves about 92% efficiency, meaning for every 10 kWh metered at the wall, roughly 9.2 kWh are stored in the battery. DC charging is slightly more efficient at around 95%, with 9.5 kWh stored per 10 kWh drawn.
What Is Charging Efficiency and Why You Lose 5-8%?
The difference stems from the conversion stages involved. AC charging requires the onboard charger to convert AC to DC, a process that inherently produces waste heat. DC charging skips this step since the station handles conversion externally with larger, more efficient power electronics. However, DC stations still have their own losses in the rectifier, cables, and cooling systems.
These percentages are industry-standard estimates that the Plan EV Charge calculator uses. Real-world efficiency varies by vehicle model, ambient temperature, charging power level, and battery state of health. Some EVs achieve 94% AC efficiency while others drop to 88%, particularly in very cold conditions where battery heating consumes additional energy.
Where Does the Lost Energy Go?
The primary source of energy loss during charging is heat. The onboard charger, power electronics, cables, and the battery cells themselves all generate heat during the energy transfer process. In an AC charging session, the onboard charger's rectifier and transformer produce the majority of the thermal losses. You can sometimes feel the warmth by touching the charging cable or the area near the charge port.
Battery conditioning accounts for another portion of the losses. In cold weather, the battery management system may divert energy to heat the battery pack to its optimal operating temperature (20-35 degrees Celsius) before allowing full charging power. In hot weather, the cooling system draws power to prevent overheating. These thermal management loads are not metered separately but reduce overall efficiency.
Smaller losses occur in the charging cable resistance (especially at higher currents), the vehicle's 12V system that stays active during charging, and the BMS monitoring electronics. At very low charging powers like 2.3 kW from a household socket, the proportional overhead of keeping vehicle systems awake can push efficiency below 90%.
Impact on Cost and Charging Time
Charging efficiency directly affects your electricity bill. To store 60 kWh in your battery via AC charging at 92% efficiency, you need to draw approximately 65.2 kWh from the grid. At 0.25 EUR/kWh, the loss costs you 1.30 EUR per full charge. Over 15,000 km of annual driving at 18 kWh/100 km consumption, the AC efficiency loss adds about 53 EUR per year.
With DC charging at 95% efficiency, the same 60 kWh requires 63.2 kWh from the grid. The loss per full charge is smaller in percentage terms, but since DC electricity prices are typically double home rates, the absolute cost of the lost energy can be similar or higher. At 0.55 EUR/kWh for DC, the 3.2 kWh loss costs 1.76 EUR per session.
Efficiency also affects charging time, though the impact is subtle. Because the charger must deliver more energy than the battery ultimately stores, the session takes slightly longer than a simple battery-size-divided-by-power calculation would suggest. For a 60 kWh battery at 7 kW AC with 92% efficiency, the actual charging time is about 9.4 hours rather than the 8.6 hours you would expect from 60 divided by 7.
How the Plan EV Charge Calculator Accounts for Efficiency
The Plan EV Charge calculator builds efficiency losses into every simulation. When you select a charger and vehicle, the calculator determines whether the session is AC or DC based on the power level (above 22 kW is classified as DC) and applies the corresponding efficiency factor: 92% for AC or 95% for DC.
This means the energy consumption shown in your results reflects the actual grid draw, not just the energy stored in the battery. If the calculator reports that your session requires 65 kWh, that is the amount your electricity meter will register, the 60 kWh that reaches the battery plus the roughly 5 kWh lost to heat and conversion. This gives you accurate cost estimates when you multiply by your electricity rate.
The time estimates also account for efficiency. Since the charger must push more energy through the system than the battery stores, the calculator accurately reflects the slightly longer session duration. Try comparing the same vehicle and SOC range on AC versus DC to see how the different efficiency factors and charging curves interact to produce different total times and energy costs.