EV Charging GuideEV Models & SpecsUnderstanding Your EV's DC Charging Curve: A Practical Guide
Understanding Your EV's DC Charging Curve: A Practical Guide
Learn how to read a DC charging curve, why peak power is not the whole story, and how temperature and state of charge shape real-world fast-charging times.
Try it with your car
Use our free calculator to simulate your exact charging time and cost.
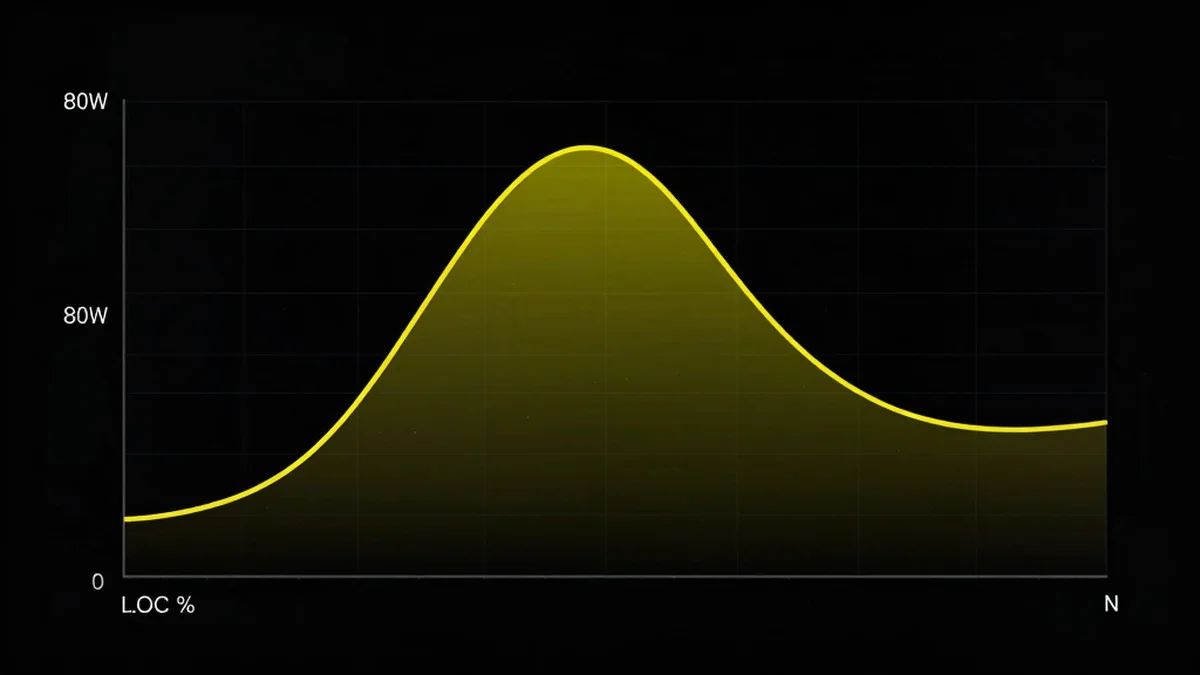
A DC charging curve is a graph that plots charging power (in kW, on the Y-axis) against battery state of charge (SOC %, on the X-axis). It shows how much power the car's battery management system (BMS) requests from the DC fast charger at every point during a charging session. Unlike AC charging -- where power is essentially flat and limited by the onboard charger -- DC charging power varies dramatically as the battery fills up.
Understanding Your EV's DC Charging Curve: A Practical Guide
A typical curve starts relatively high at low SOC (say 10 %), rises to a peak somewhere between 10-40 % SOC, and then gradually tapers down as the battery approaches 80 %. Above 80 %, most cars reduce power sharply, which is why the general advice is to charge to 80 % on road trips and move on.
The shape of this curve is unique to each EV model and is determined by battery chemistry, cell format, thermal management design, and software tuning. Two cars with identical peak power ratings can have wildly different real-world charging times because one sustains high power across a wider SOC range. The curve is the single most important spec for evaluating fast-charging performance.
Peak Power vs Sustained Power
Manufacturers love to advertise peak DC charging power: 250 kW for the Tesla Model Y, 239 kW for the Hyundai Ioniq 5, 170 kW for the VW ID.3. But peak power often lasts only for a narrow SOC window -- sometimes as little as 5-10 percentage points. What matters for your road-trip stop is the average power across the 10-80 % range.
Consider two hypothetical cars both rated at 200 kW peak. Car A holds 200 kW from 10-30 % SOC, then drops linearly to 50 kW by 80 %. Car B holds 150 kW from 10-60 % SOC, then drops to 80 kW by 80 %. Car B will finish 10-80 % faster despite a lower peak, because it sustains higher power through the middle of the charge.
To estimate average charging power, look for the 10-80 % time in published tests or use Plan EV Charge, which simulates the full curve second by second. As a rough rule of thumb: divide usable energy added (kWh from 10-80 %) by time (hours) to get average power. If the average is less than half the advertised peak, the curve tapers aggressively.
How Temperature and SOC Affect the Curve
Battery temperature is the biggest external factor that reshapes your DC charging curve. Lithium-ion cells charge most efficiently between 25-35 degrees C. Below 15 degrees C, internal resistance rises and the BMS reduces charging power to prevent lithium plating -- a damaging process that can permanently reduce capacity. In winter, a cold-soaked battery might accept only 50-60 % of its rated peak power until it warms up.
This is why battery preconditioning matters. Cars like the Tesla Model Y, Hyundai Ioniq 5, and BMW iX automatically heat the battery when you navigate to a fast charger. Preconditioning can boost cold-weather charging speeds by 30-50 %, cutting a winter 10-80 % session from 45 minutes back down to near-optimal times. If your car supports it, always use navigation-triggered preconditioning before DC fast-charging in cold weather.
State of charge also plays a critical role. The BMS progressively reduces current as cells approach full voltage to prevent overcharging. This is why power drops above 80 % SOC. Charging from 80-100 % can take nearly as long as 10-80 % on many models. For road trips, the optimal strategy is to arrive at each charger with 10-15 % SOC and leave at 80 %, maximising time spent in the high-power zone of the curve.
Reading DC Curve Charts and What to Look For
When evaluating a DC charging curve chart, focus on four key features. First, the ramp-up: how quickly does power reach its peak? Some cars (like the Ioniq 5) hit peak power almost immediately at 10 % SOC, while others (like the VW ID.3) ramp up gradually and peak around 20-25 %. A fast ramp means more energy delivered in the first few minutes.
Second, look at the plateau width -- the SOC range over which the car sustains near-peak power. A wide plateau (e.g., 10-50 % SOC at full power) is the hallmark of an excellent fast charger. The Ioniq 5 and Kia EV6 are famous for their wide plateaus thanks to 800 V architecture. Third, examine the taper rate: how steeply does power drop after the plateau? A gentle taper from 50-80 % is far better than a cliff at 40 %.
Fourth, note the power level at 80 % SOC. Some cars still deliver 40-50 kW at 80 %, making it worthwhile to charge a few extra percent. Others drop to 20 kW or below, making every percent above 80 % painfully slow. Plan EV Charge uses real curve data for each vehicle, so you can simulate any SOC range and see exactly how long each segment takes -- no guesswork required.